Tracing query performance with Knex.js

Tracing query performance with Knex.js
Over the years, I found myself searching for the same exact problem whenever I was using Knex.js, the query planner for Node.js. Since, the following code snippet is small enough to not be a Node library, I’m intrigued to share this as a blog post.
Initially, a blog post from Atomic Object proposed to use query and query-response events on the knex.js instance, since it’s also an event emitter, but I guess it’s time to use perf_hooks and properly mark the performance of a query using the native tooling.
import { PerformanceObserver, performance } from 'perf_hooks'

const performanceObserver = new PerformanceObserver((list) => {
  list.getEntries().forEach((entry) => {
    console.group(`${entry.duration.toFixed(2)} ms`)
    console.info(entry.name)
    console.groupEnd()
  })
})
performanceObserver.observe({ buffered: true, entryTypes: ['measure'] })

pg.on('query', (query) => {
  const id = query.__knexQueryUid
  performance.mark(`${id}-started`)
}).on('query-response', (response, query) => {
  const id = query.__knexQueryUid
  performance.mark(`${id}-ended`)
  performance.measure(query.sql, `${id}-started`, `${id}-ended`)
})
Small snippet using perf_hooks
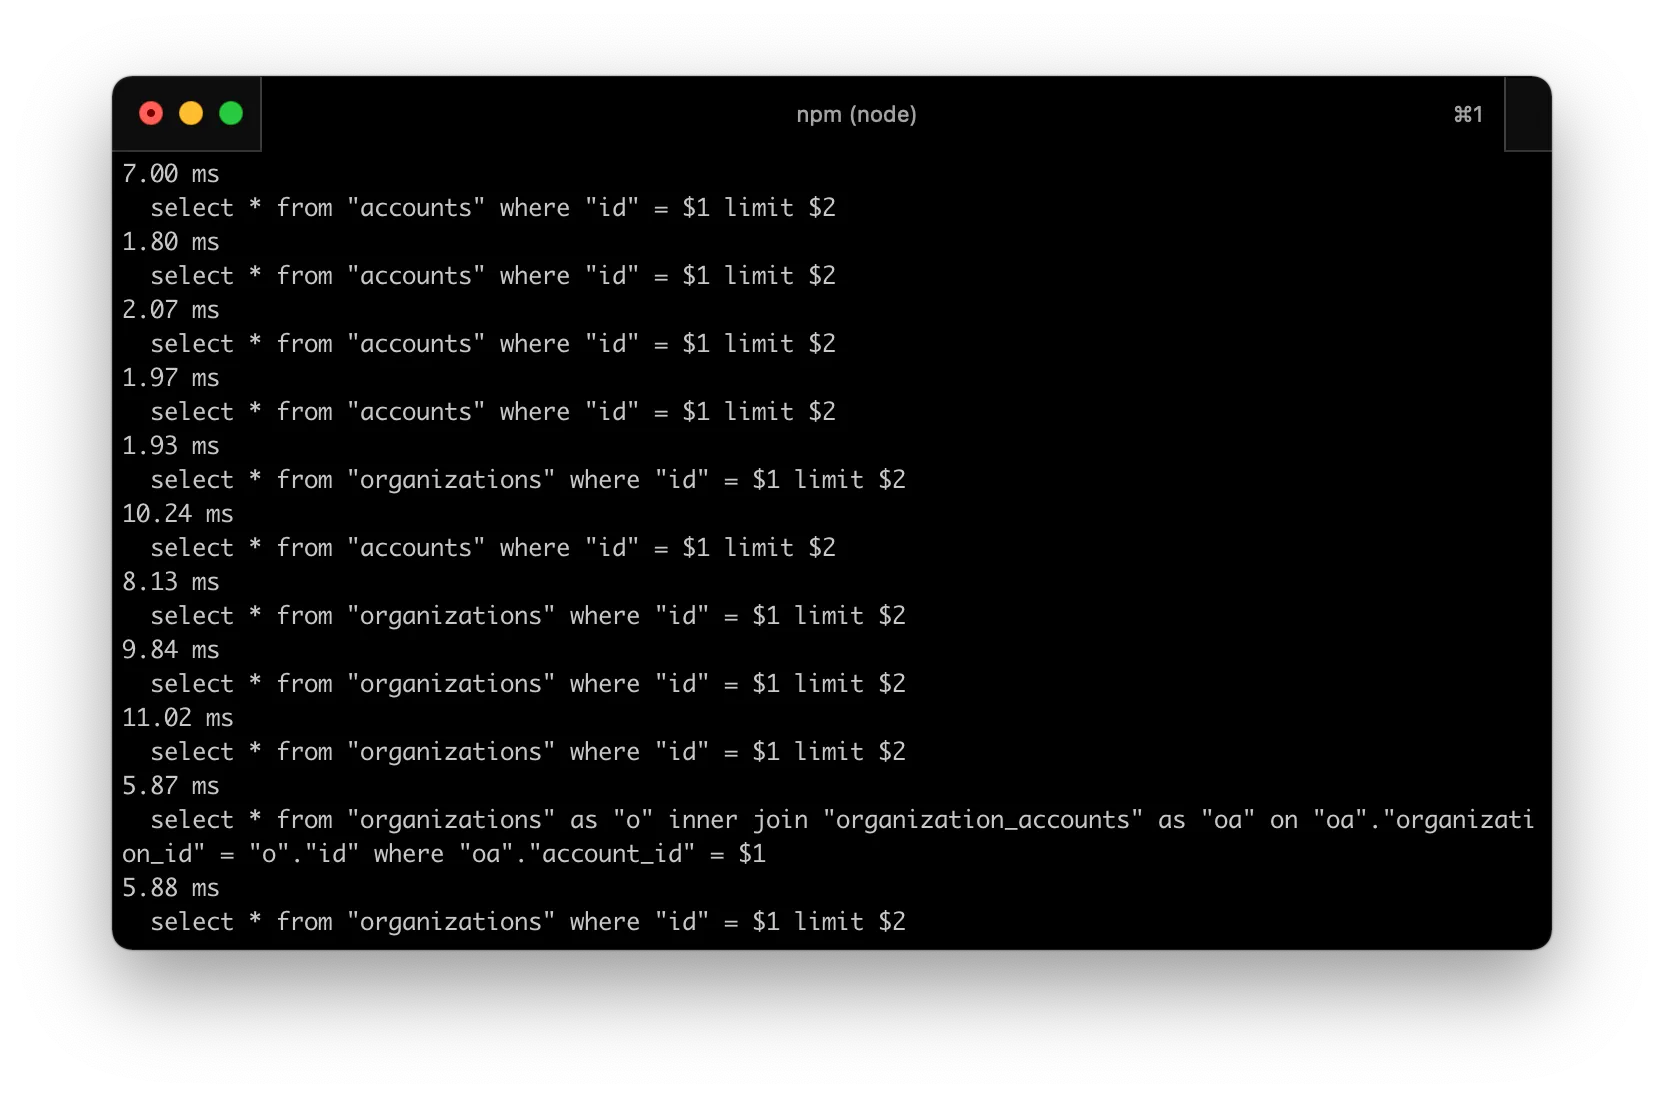
With the following code, we’ll see the following code on our terminal.